The data analysis process for RNA and the Cy5-labeled nucleic acids assays consists of the following steps.
-
-
- Raw data is read and stored by the system for all of the individual samples.
- The data is filtered and the resulting electropherograms of all samples are plotted. You can change the settings of the data analysis after the run and reanalyze your data.
- Fragments are identified for all samples and tabulated by peak ID. You can change the settings of the peak find algorithm for any or all samples and reanalyze the data.
- An RNA ladder (containing a mixture of RNA of known concentration) is run first (see the electropherogram below). The concentrations and sizes of the individual base pairs are preset in the assay and cannot be changed.
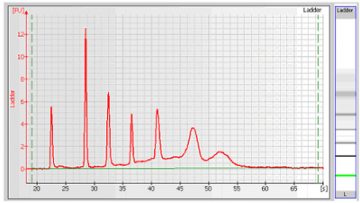
Electropherogram of RNA 6000 Ladder (Ambion, Inc. cat. no. 7152)
Note: peak ratios for the RNA ladder may vary from one batch of RNA 6000 ladder to the next. Assay performance will not be affected by this variation.
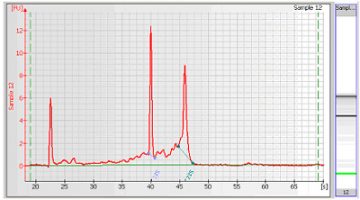
- For the Eukaryote or Prokaryote Total RNA assay, the RNA fragments (either 18S and 28S for eukaryotic RNA or 16S and 23S for prokaryotic RNA) are detected. After detection, the ratio of the fragment areas is calculated and displayed.
- To calculate the concentration of the RNA, the area under the entire RNA electropherogram is determined. The ladder, which provides the concentration/area ratio, is applied to transform the area values into concentration values.
-
RNA Assays
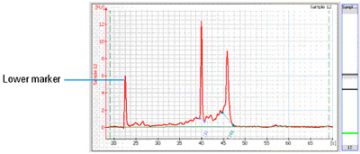
The marker solution that is part of each RNA LabChip kit, contains a 50 bp DNA fragment. This fragment is used as lower marker to align all samples.
By default the RNA alignment and the subtraction of the lower marker are enabled for RNA Nano assay
The marker is displayed as the first peak in the electropherogram:
Source
Adapted from the Agilent 2100 expert software online help. Copyright © Agilent Technologies, all rights reserved. Version 25.11.2003.
Return to Bioanalyzer Services