The electrophoretic assays on the Agilent Bioanalyzer are based on traditional gel electrophoresis principles that have been transferred to a chip format. The chip format dramatically reduces separation time and sample consumption. The system provides automated sizing and quantitation information in a digital format. On-chip gel electrophoresis is performed for the analysis of DNA, RNA and proteins.
Chip Architecture and Function
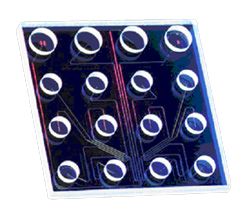 The chip accommodates sample wells, gel wells and a well for an external standard (ladder). Micro-channels are fabricated in glass to create interconnected networks among these wells. During chip preparation, the micro-channels are filled with a sieving polymer and fluorescence dye. Once the wells and channels are filled, the chip becomes an integrated electrical circuit. The 16-pin electrodes of the cartridge are arranged so that they fit into the wells of the chip. Each electrode is connected to an independent power supply that provides maximum control and flexibility.
Charged biomolecules like DNA or RNA are electrophoretically driven by a voltage gradient-similar to slab gel electrophoresis. Because of a constant mass-to-charge ratio and the presence of a sieving polymer matrix, the molecules are separated by size. Smaller fragments are migrating faster than larger ones. Dye molecules intercalate into DNA or RNA strands or Protein-SDS micells. These complexes are detected by laser-induced fluorescence. Data is translated into gel-like images (bands) and electropherograms (peaks). With the help of a ladder that contains fragments of known sizes and concentrations, a standard curve of migration time versus fragments size is plotted. From the migration times measured for each fragment in the sample, the size is calculated. Two marker fragments (for RNA only one marker fragment) are run with each of the samples bracketing the overall sizing range. The “lower” and “upper” markers are internal standards used to align the ladder data with data from the sample wells. This is necessary to compensate for drift effects that may occur during the course of a chip run.
Analysis
For DNA and protein assays, quantitation is done with the help of the upper marker. The area under the upper marker peak is compared with the sample peak areas. Because the concentration of the upper marker is known, the concentration for each sample can be calculated. Besides this relative quantitation, an absolute quantitation is available for protein assays, using external standard proteins.
For RNA assays, quantitation is done with the help of the ladder area. The area under the ladder is compared with the sum of the sample peak areas. The area under the “lower” marker is not taken into consideration. For total RNA assays, the ribosomal ratio is determined, giving an indication on the integrity of the RNA sample.
Output Examples
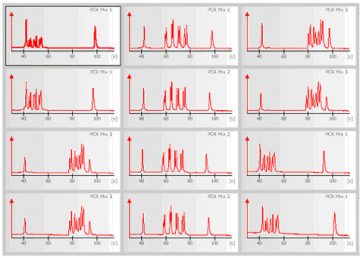
The 2100 expert software plots fluorescence intensity versus migration time and produces an electropherogram for each sample.
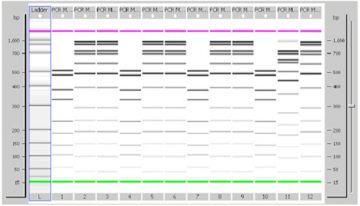
The data can also be displayed as a densitometry plot, creating a gel-like image.
Source
Adapted from the Agilent 2100 expert software online help. Copyright © Agilent Technologies, all rights reserved. Version 25.11.2003.
Return to Bioanalyzer Services