The data analysis process for DNA assays consists of the following steps.
- Raw data is read and stored by the system for all of the individual samples.
- The data is filtered and the resulting electropherograms of all samples are plotted. You can change the settings of the data analysis after the run and reanalyze your data.
- Peaks are identified for all samples and are tabulated by peak ID. You can change the settings of the peak find algorithm and reanalyze the data after the run has finished. Note that peak find settings can be changed for all or only certain samples.
- A sizing ladder (see the example electropherogram below), which is a mixture of DNA fragments of known sizes, is run first from the ladder well. The concentrations and sizes of the individual base pairs are preset in the assay and cannot be changed.
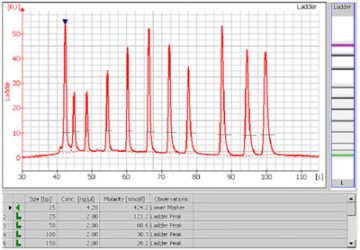
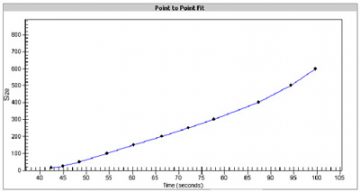
- A standard curve of migration time versus DNA size is plotted from the DNA sizing ladder by interpolation between the individual DNA fragment size/migration points. The standard curve derived from the data of the ladder well should resemble the one shown below.
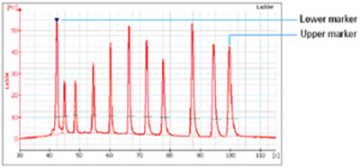
- Two DNA fragments are run with each of the samples, bracketing the DNA sizing range. The “lower marker” and “upper marker” are internal standards used to align the ladder data with data from the sample wells. The figure below shows an example of assigned marker peaks in a sample well.
Note: the software performs alignment by default. Turning automatic data analysis off (see Electropherogram Menu) suspends data analysis until you turn it on again.
- The standard curve, in conjunction with the markers, is used to calculate DNA fragment sizes for each sample from the migration times measured.
- To calculate the concentration of the individual DNA fragments in all sample wells, the upper marker, in conjunction with an assay-specific concentration against base-pair size calibration curve, is applied to the individual sample peaks in all sample wells.
Note: the software allows you to redefine the peaks chosen as upper and lower markers. A change in marker selection will cause quantitative changes in the calibration procedure, however, and therefore in the entire data evaluation.
- If the checkbox Rest. Digest on the Chip Summary Tab is enabled, the 2100 expert software flags peaks that may have co-migrated.
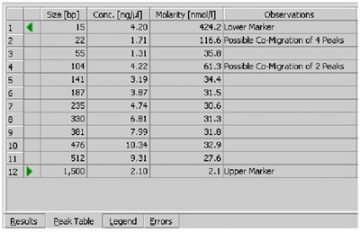
- Since it is assumed that the molarity of all the fragments in a restriction digest should be the same, any peaks or clusters having a molarity that is significantly larger than the rest are flagged as potentially co-migrating peaks, allowing you to examine them in more detail.
Source
Adapted from the Agilent 2100 expert software online help. Copyright © Agilent Technologies, all rights reserved. Version 25.11.2003.
Return to Bioanalyzer Services